Unveiling Product Analytics
Uncover the hidden gems within your product data with our powerful Product Analytics feature. This feature provides you with valuable insights into your customers' buying behavior via Storyly.
Here is the new Product Analytics page; offering variety of metrics and a Best Performing Products section. Let's dive into detailed product insights with our comprehensive table.
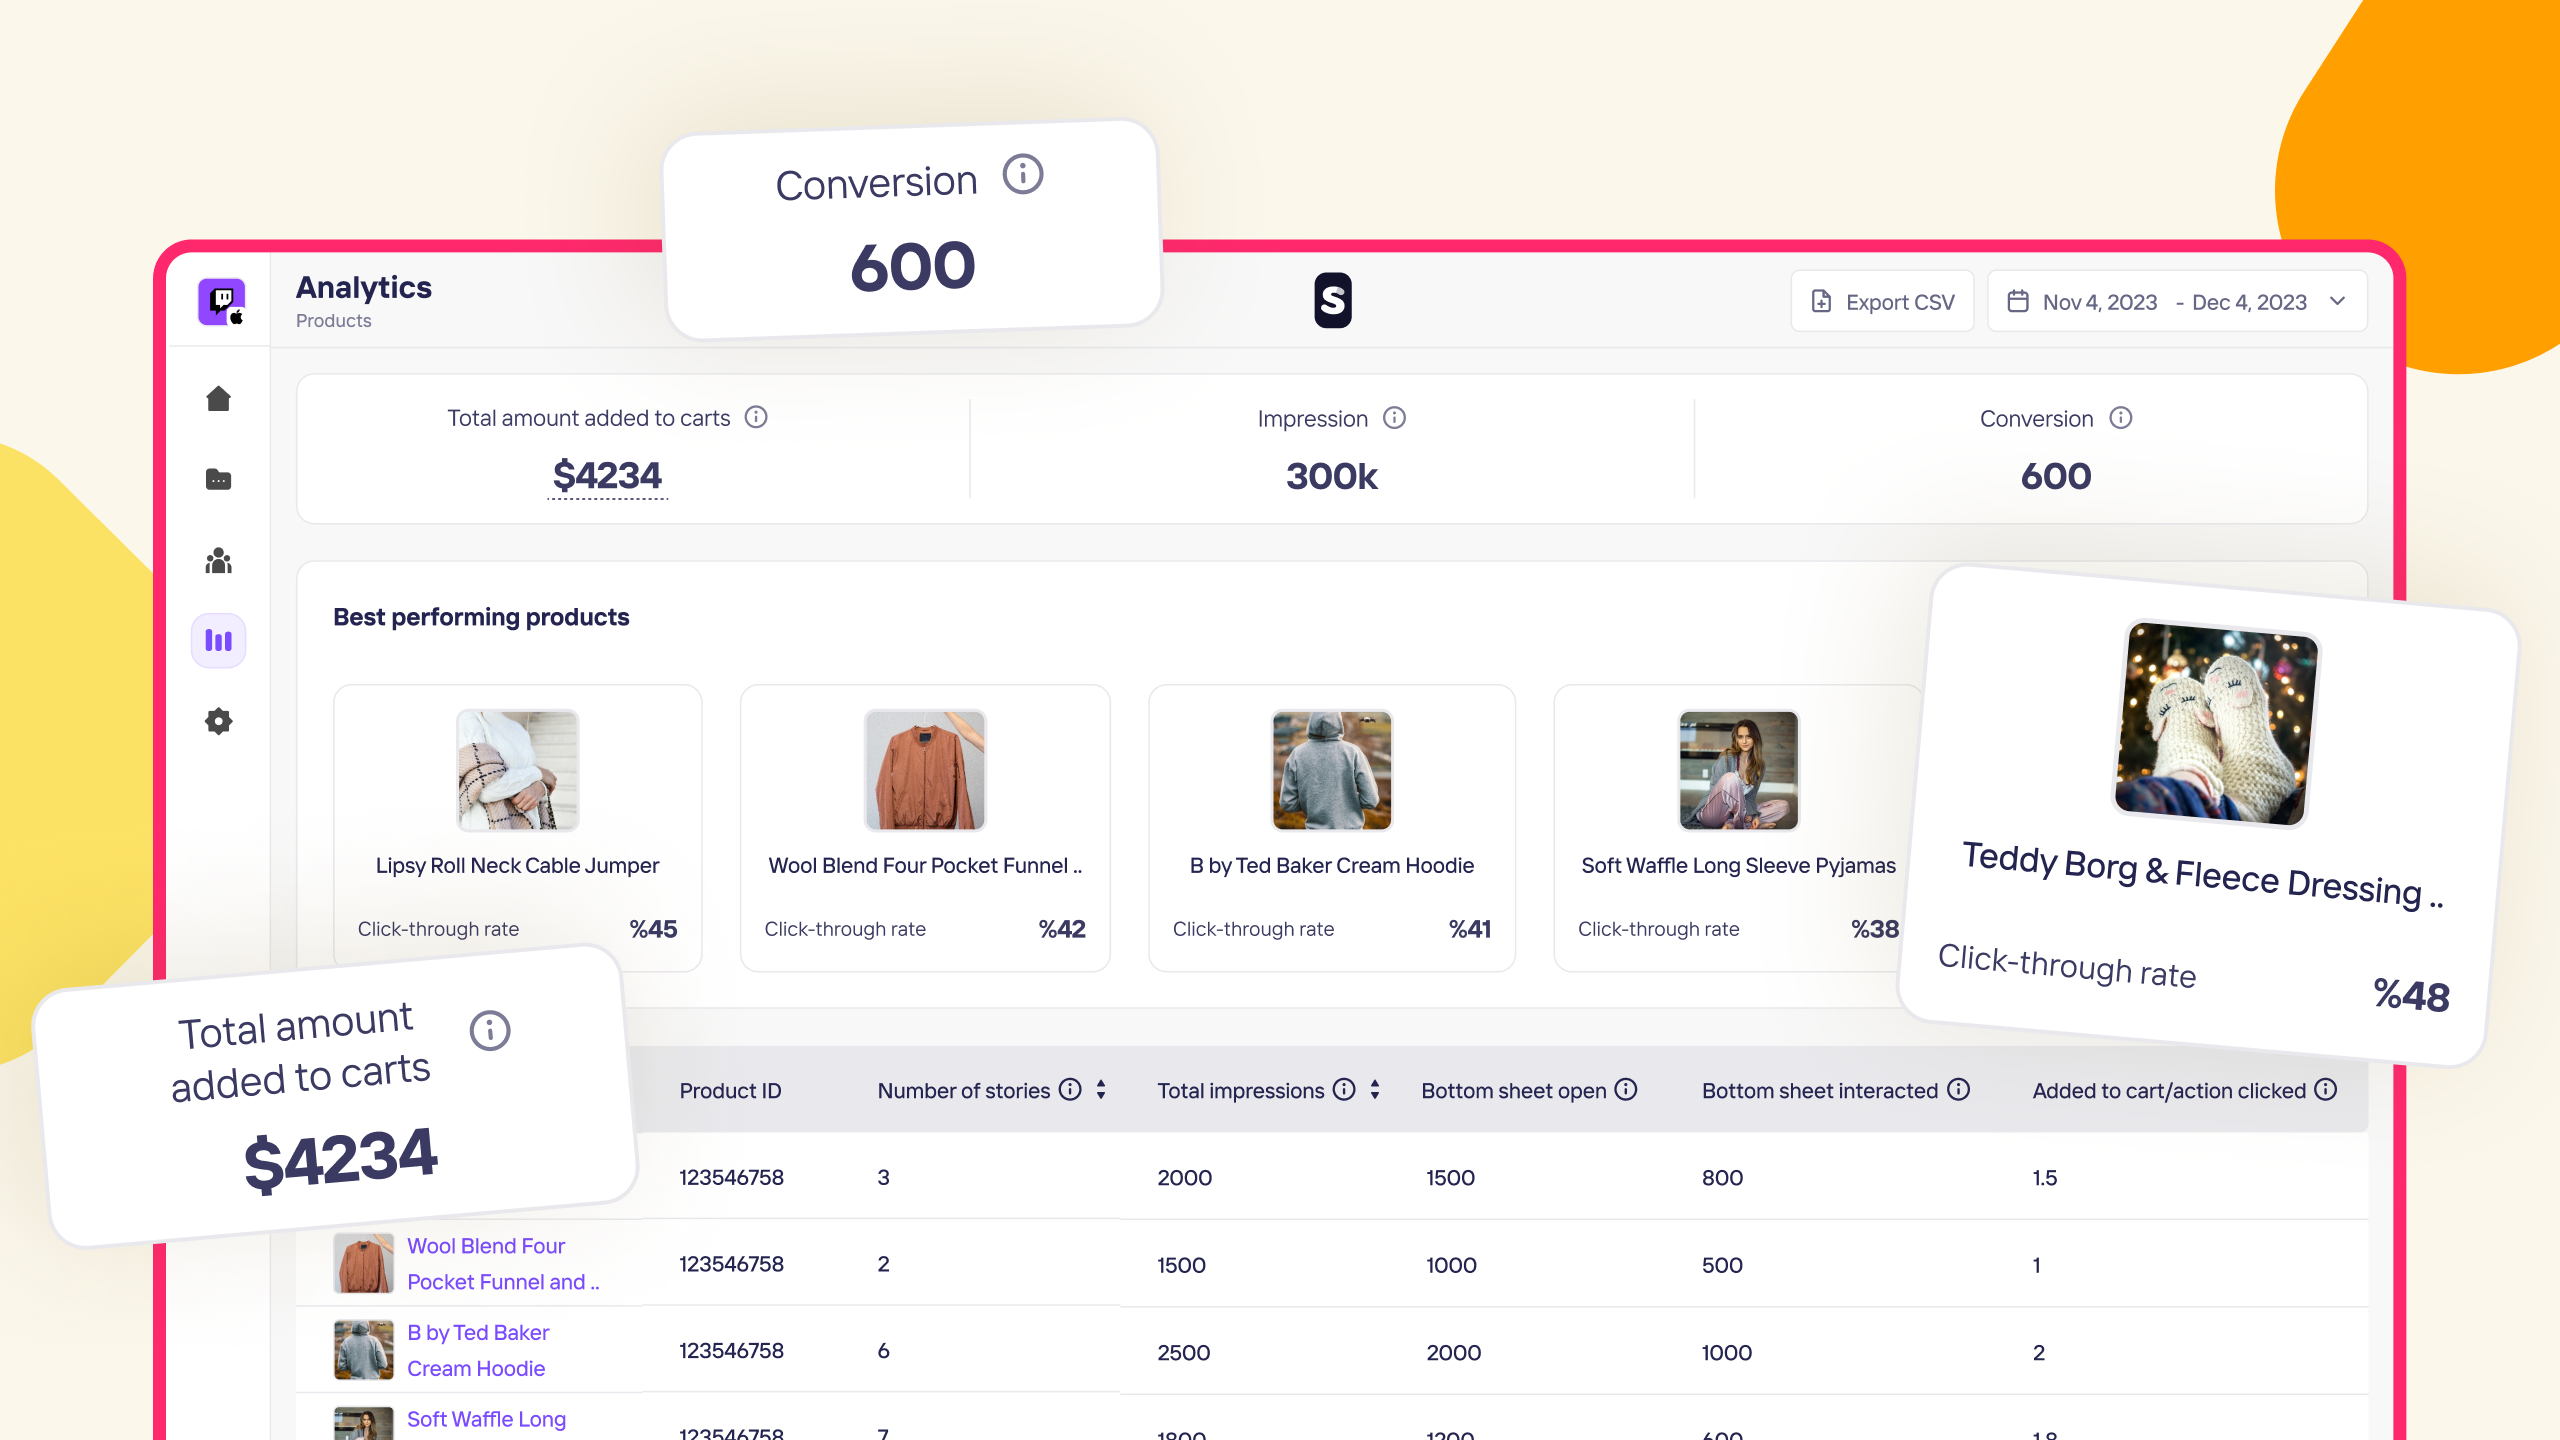
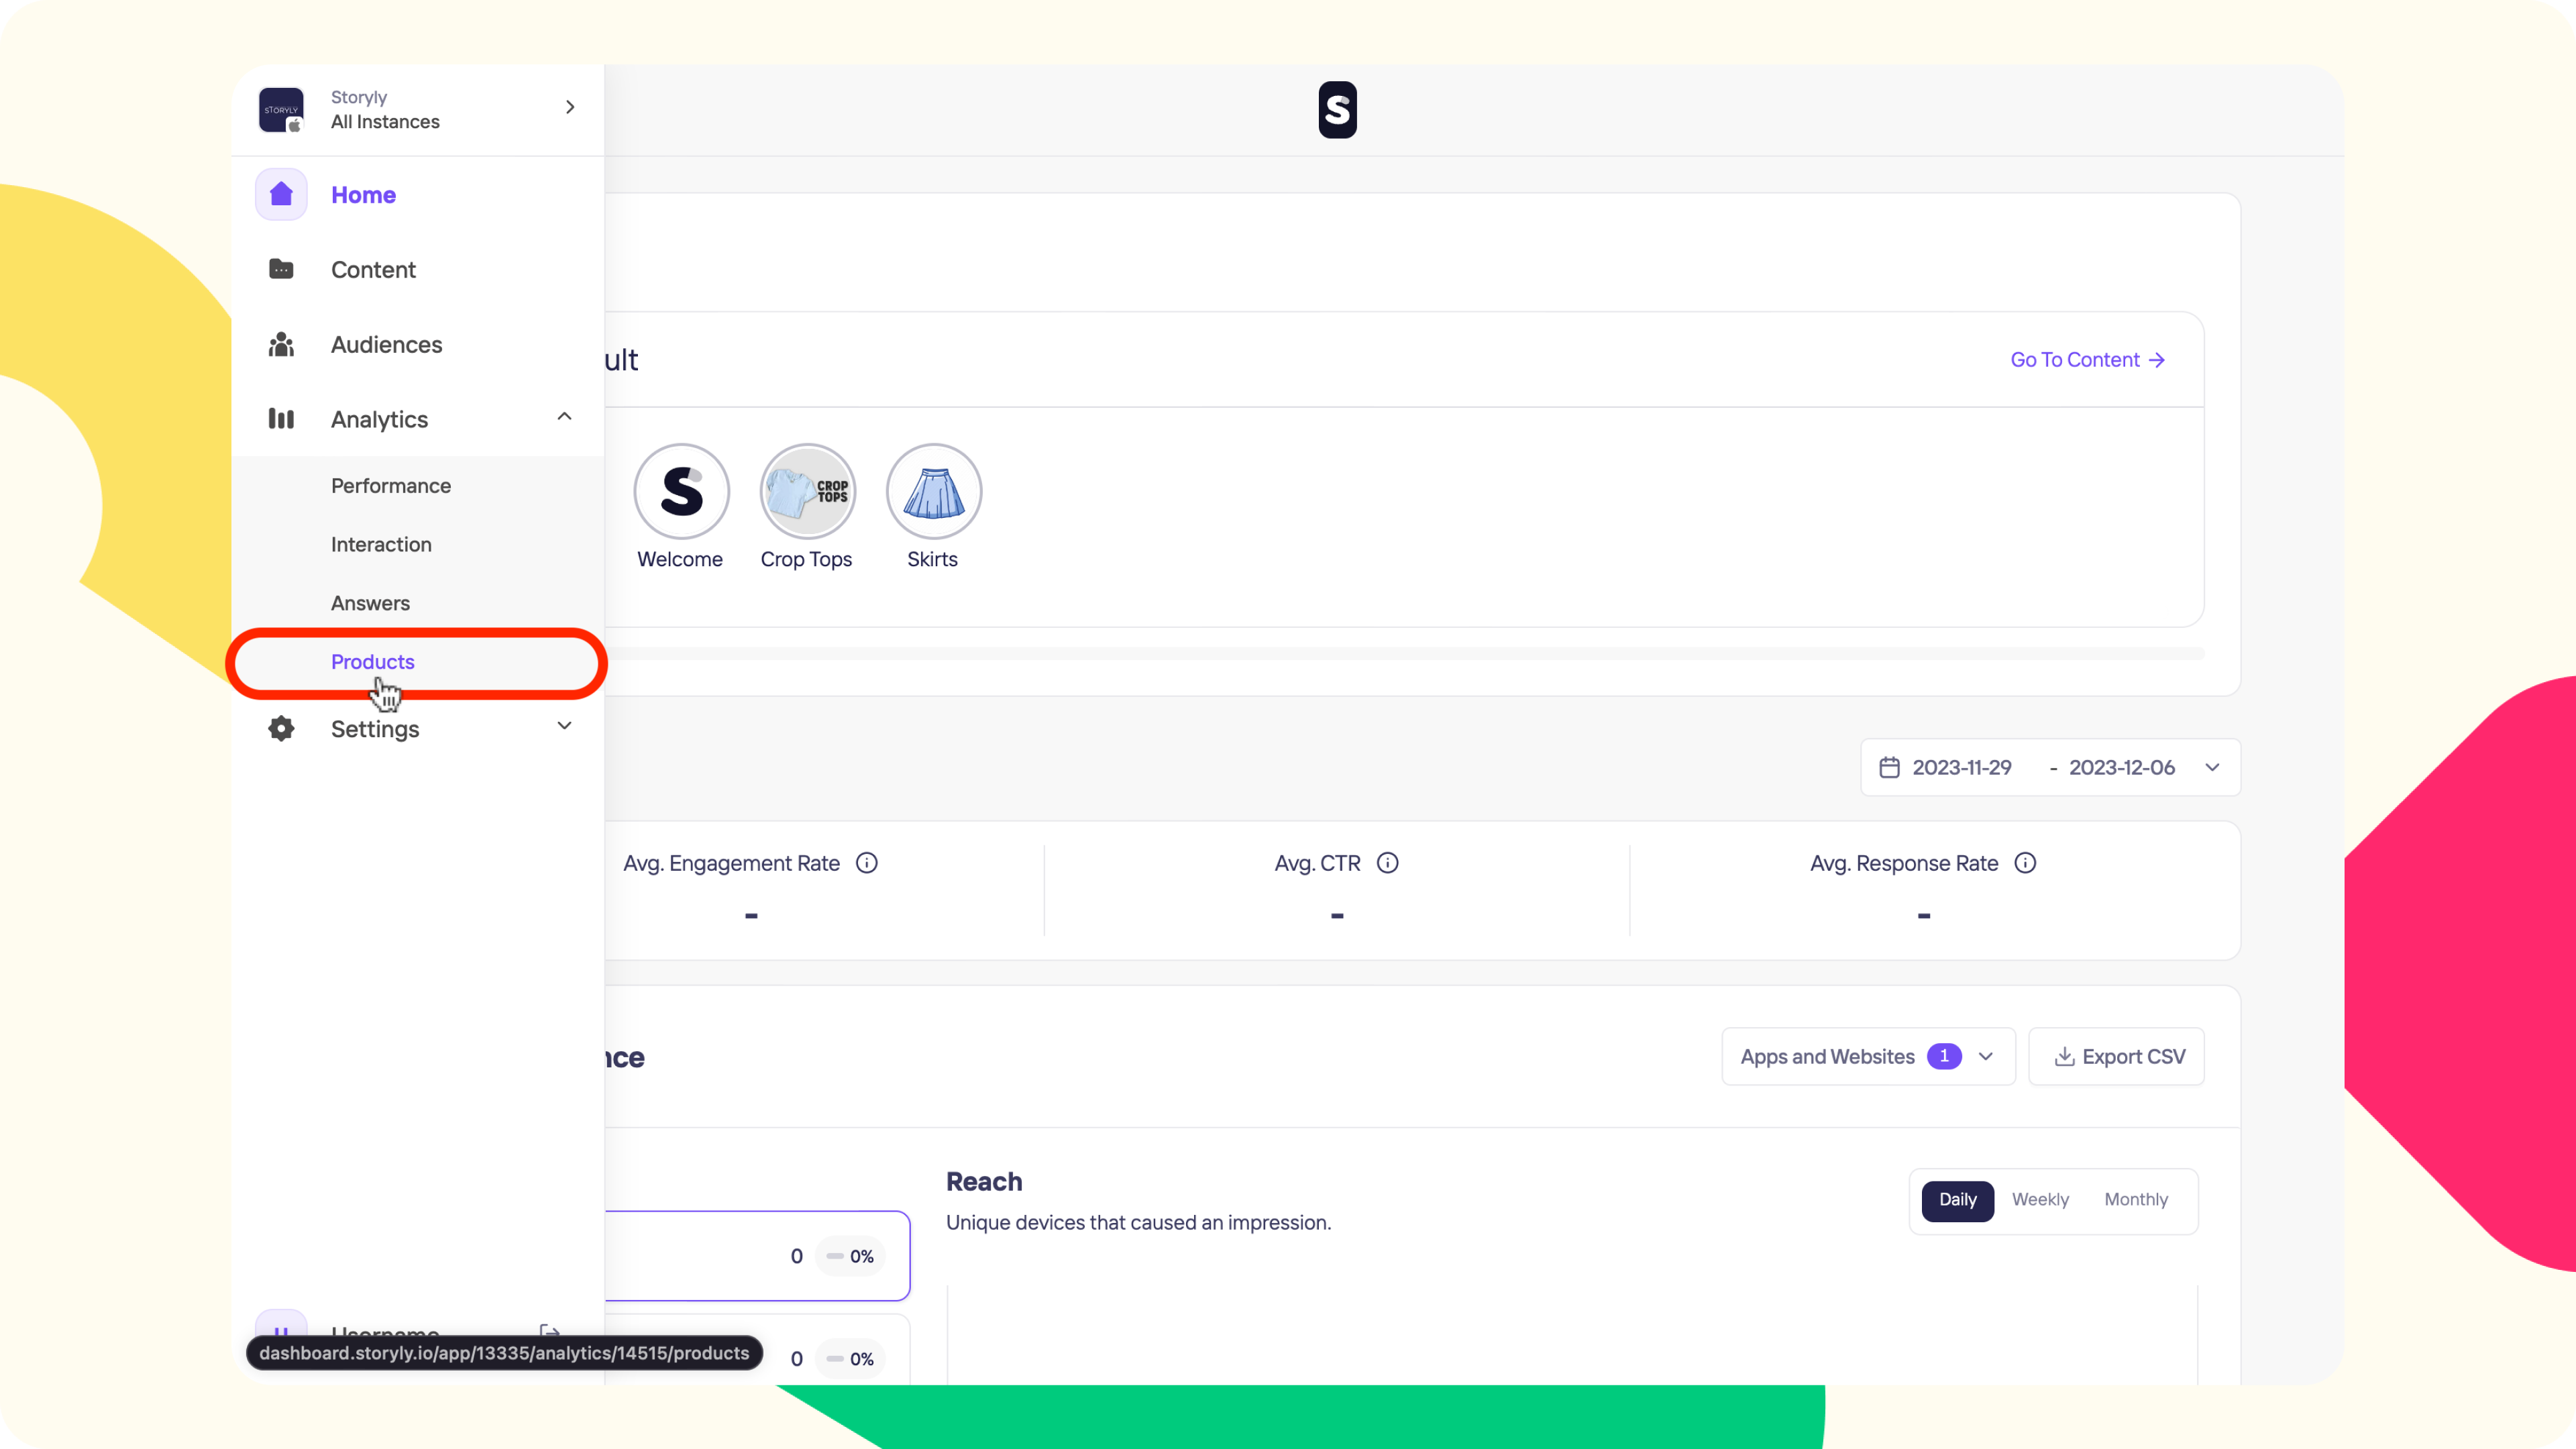
You can find Products tab under Analytics section. There are multiple actions you can take here.
- You can export your Product analytics as CSV.
- You can change the date from the date picker to see the performance of your products in the selected date range.
Within this page, you'll find detailed metrics for products featured in your Stories. These metrics are derived from user interactions with product-related elements such as Swipe-Up, Click button, Product Tag, Product Card, and Product Catalog.
Total Cart Value: The total price of products that have been added to cart via Stories.
Impression: The total number of views that your products got via Stories.
Conversion: The total number of products that have been added to cart via Stories.
Click-through rate: Upon clicking on these interactive elements, Storyly triggers a pop-up displaying detailed information about the corresponding product in a bottom sheet. This metric represents the ratio of bottom sheet openings to product impressions.
Under the Best Performing Products section, you can sort the products based on their Conversion or Click-through rates.
With Product Analytics, you have the power to transform your product data into actionable insights, propelling your sales to new heights via Storyly.